


New article
Recently updated
Changing the display style of a line trend visual

Who is this article for?
Users who need to configure line trend visual display settings.
Users must have access to the Visual Gallery or a dashboard with a line trend visual.
Line trend visuals can be displayed as a plain line, filled area, or gradient area, with straight or smooth lines, and can be stacked when grouped by an attribute.
Opening the line chart settings
To open the line chart settings:
- Select the line trend visual in the Visual Gallery or on a dashboard.
- If it is on a dashboard, select Settings on the visual drop-down menu.
- On the sidebar menu, open the visual settings.
The Line Chart Settings sidebar opens.
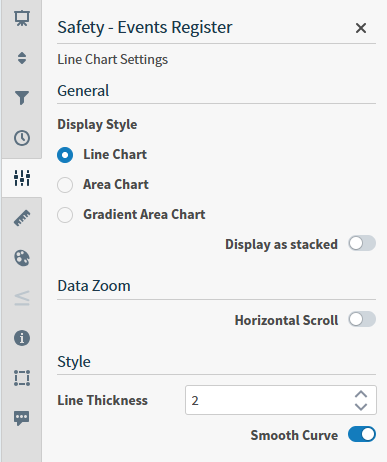
Configuring display style
To choose a display style:
- Under Display Style, choose one of the following options:
- Line Chart: a plain line (this is the default)
- Area Chart: a solid fill under the line
- Gradient Area Chart: a fill that fades from solid at the line to clear at the bottom
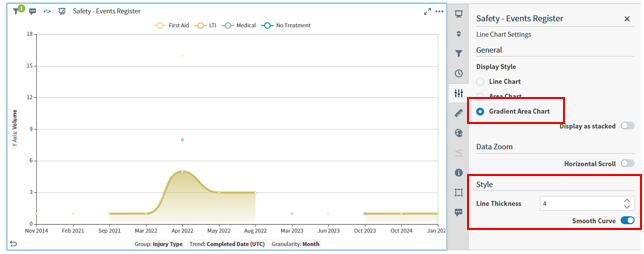
Configuring line thickness and smooth curves
To adjust line appearance:
- Line Thickness: use the number box to make the line thicker or thinner
- Smooth Curve: turn this on to draw the line as a smooth curve instead of straight segments (it works with any display style)
Stacking the series
When the visual is grouped by an attribute, such as Category, it shows one series for each group.
To stack the series:
- Turn on Display as stacked.
- Choose a Stacking Style: Stacked to add the series on top of one another, or 100% Stacked to show each series as a share of the total.
Note: The stacking options appear only when the visual has more than one series.
Changing series colours
To change series colours:
- Open the Colour sidebar.
- To set your own colour for a series, clear Inherit from theme.
- Choose a colour for each group in the list of assigned colours.